Software
I develop new analytical methods and computational tools for the spatial analysis of urban systems, following the principles of open source and open science. As a core developer for PySAL the Python Spatial Analysis Library for open-source, cross-platform geospatial data science, most of this work is focused on extending the ecosystem for spatial analysis neighborhood dynamics in Python. In addition, I am a core developer or maintainer of a variety of packages for urban analysis, visualization, and exploration. For a complete listing of software projects, see my github page
PySAL: The Python Spatial Analysis Library
PySAL, the Python spatial analysis library, is an open source cross-platform library for geospatial data science with an emphasis on geospatial vector data written in Python. It supports the development of high level applications for spatial analysis, such as (1) detection of spatial clusters, hot-spots, and outliers, (2) construction of graphs from spatial data, (3) spatial regression and statistical modeling on geographically embedded networks, (4) spatial econometrics, and (5) exploratory spatio-temporal data analysis. The package has a rich history in formal spatial analysis and continues to expand in depth and scope.
More
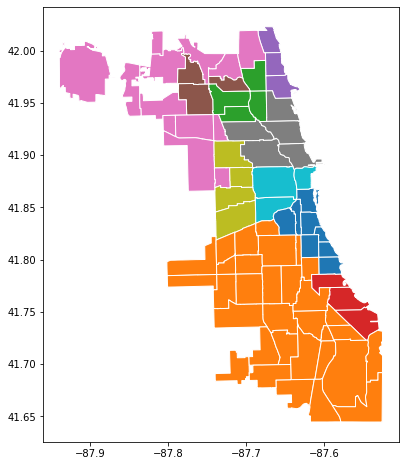
geosnap : The Geospatial Neighborhood Analysis Package
geosnap is a python package for exploring, modeling, analyzing, and visualizing the social and spatial dynamics of neighborhoods. It provides a suite of tools for creating datasets, harmonizing them into consistent, time-static boundaries. It also allows for modeling bespoke neighborhoods and prototypical neighborhood types, and modeling neighborhood change using classic and spatial statistical methods.
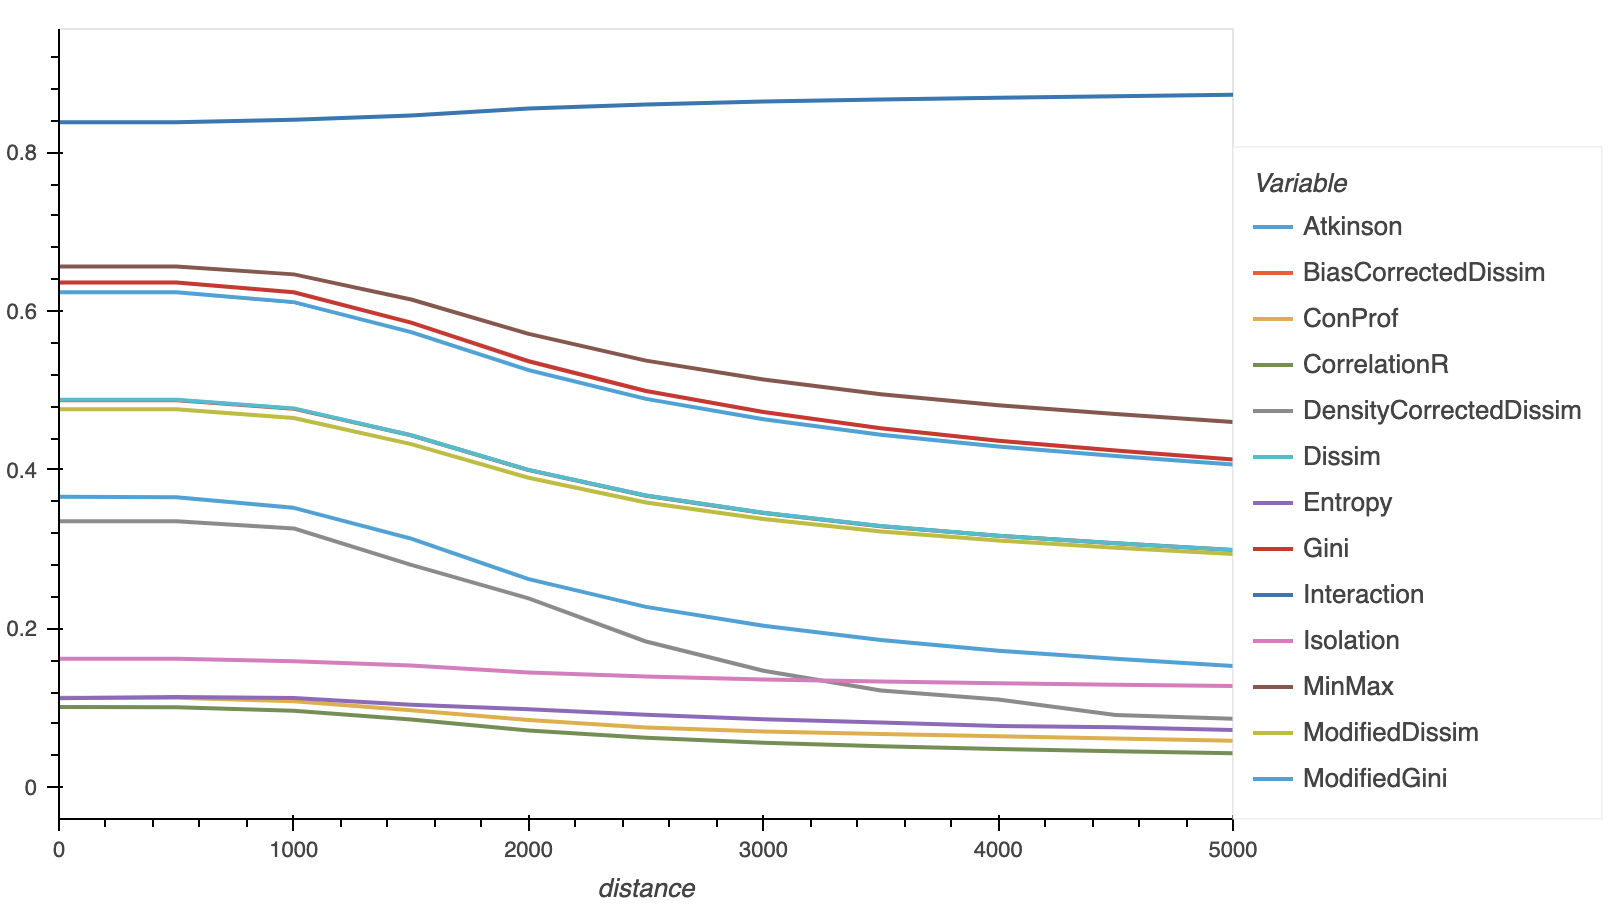
PySAL: segregation
The PySAL segregation package provides state-of-the-art tools for quantitative segregation analysis. It allows simple calculation of over 40 different segregation indices, including classic, spatial, and locally-varying measures, and provides frameworks for examining how segregation measures change over space and time and includes a suite of additional features for measurement, visualization, and hypothesis testing, and statistical decomposition.
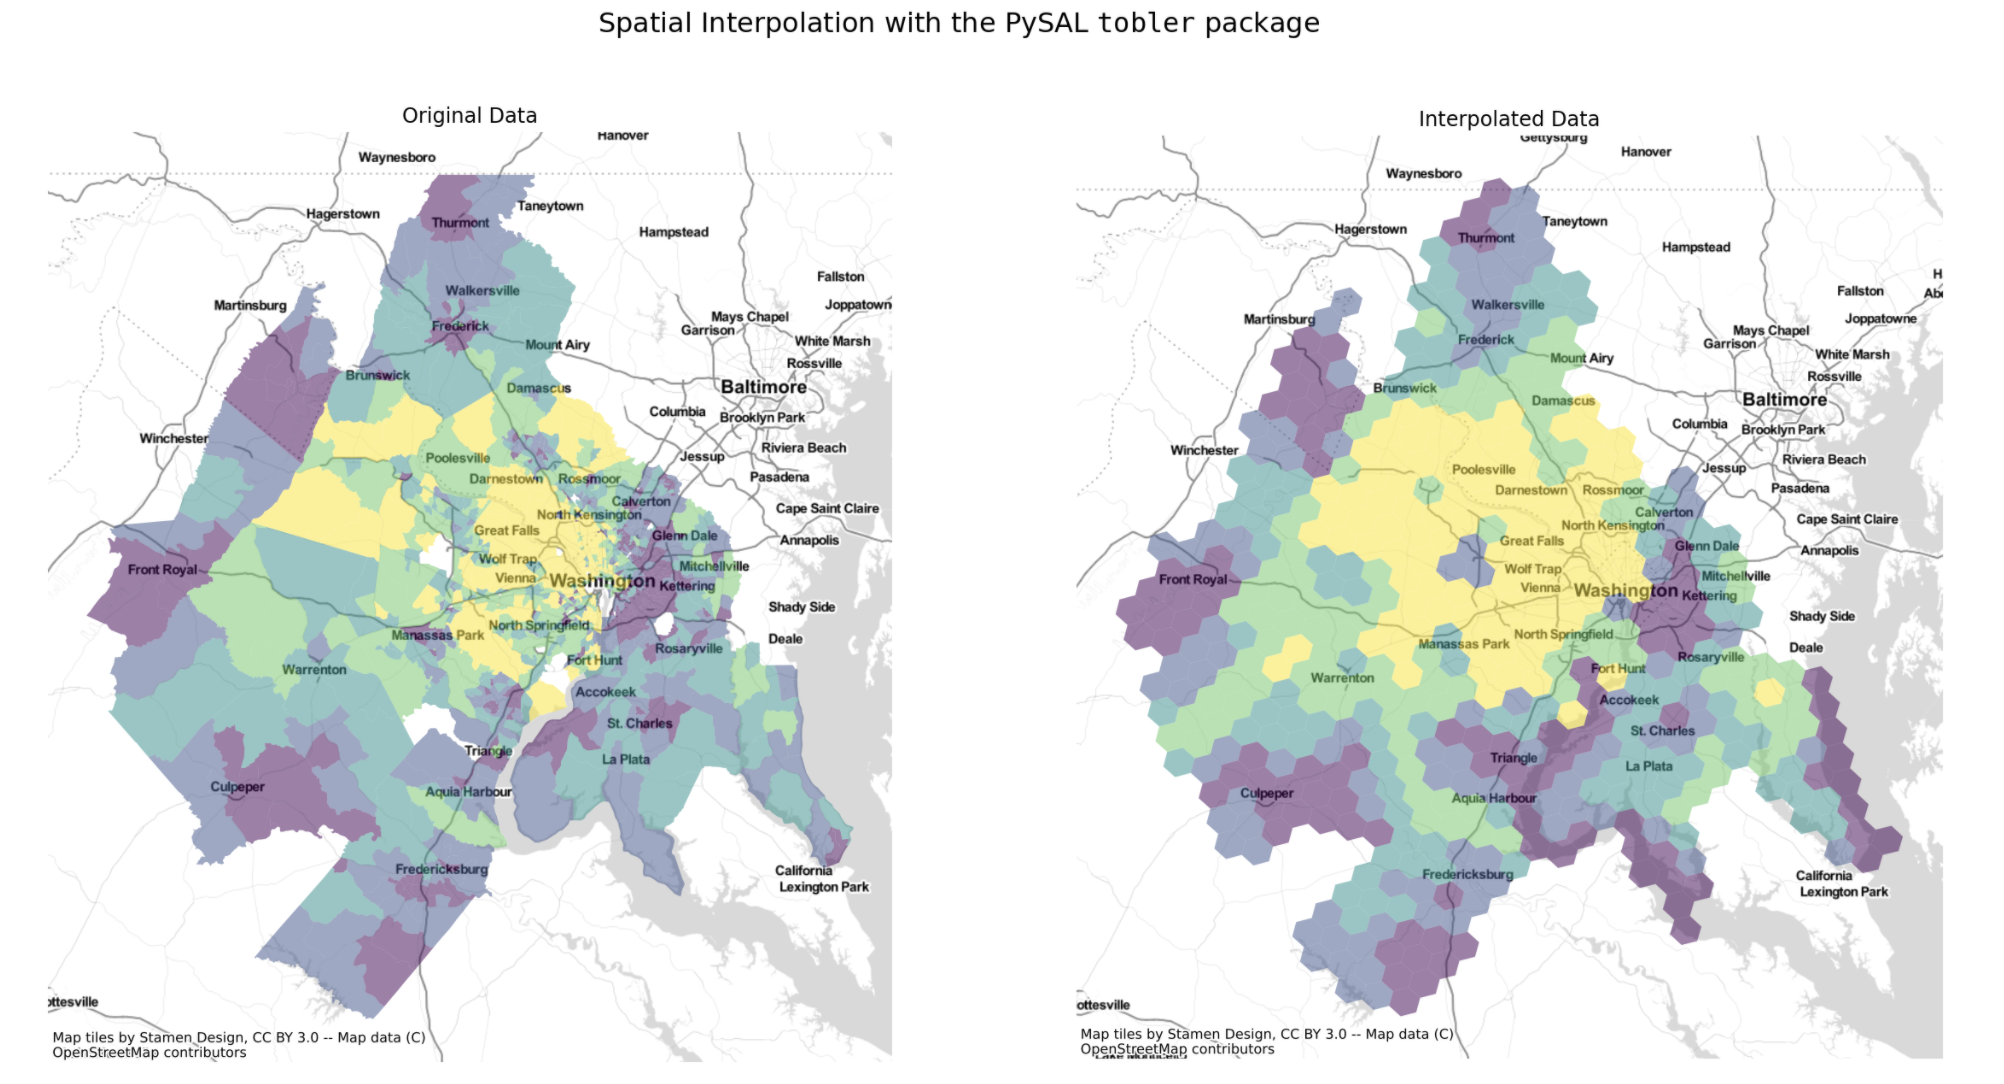
PySAL: tobler
The PySAL tobler package provides functionality for areal interpolation and dasymetric mapping. It helps researchers and analysts transfer geographic data from one representation to another, including additional tools for helping reduce error. Tobler includes functionality for interpolation methods using area-weighted approaches, regression model-based techniques that leverage other auxiliary information, dasymetric approaches that allow masking via other data such as satellite imagery, and hybrid approaches.
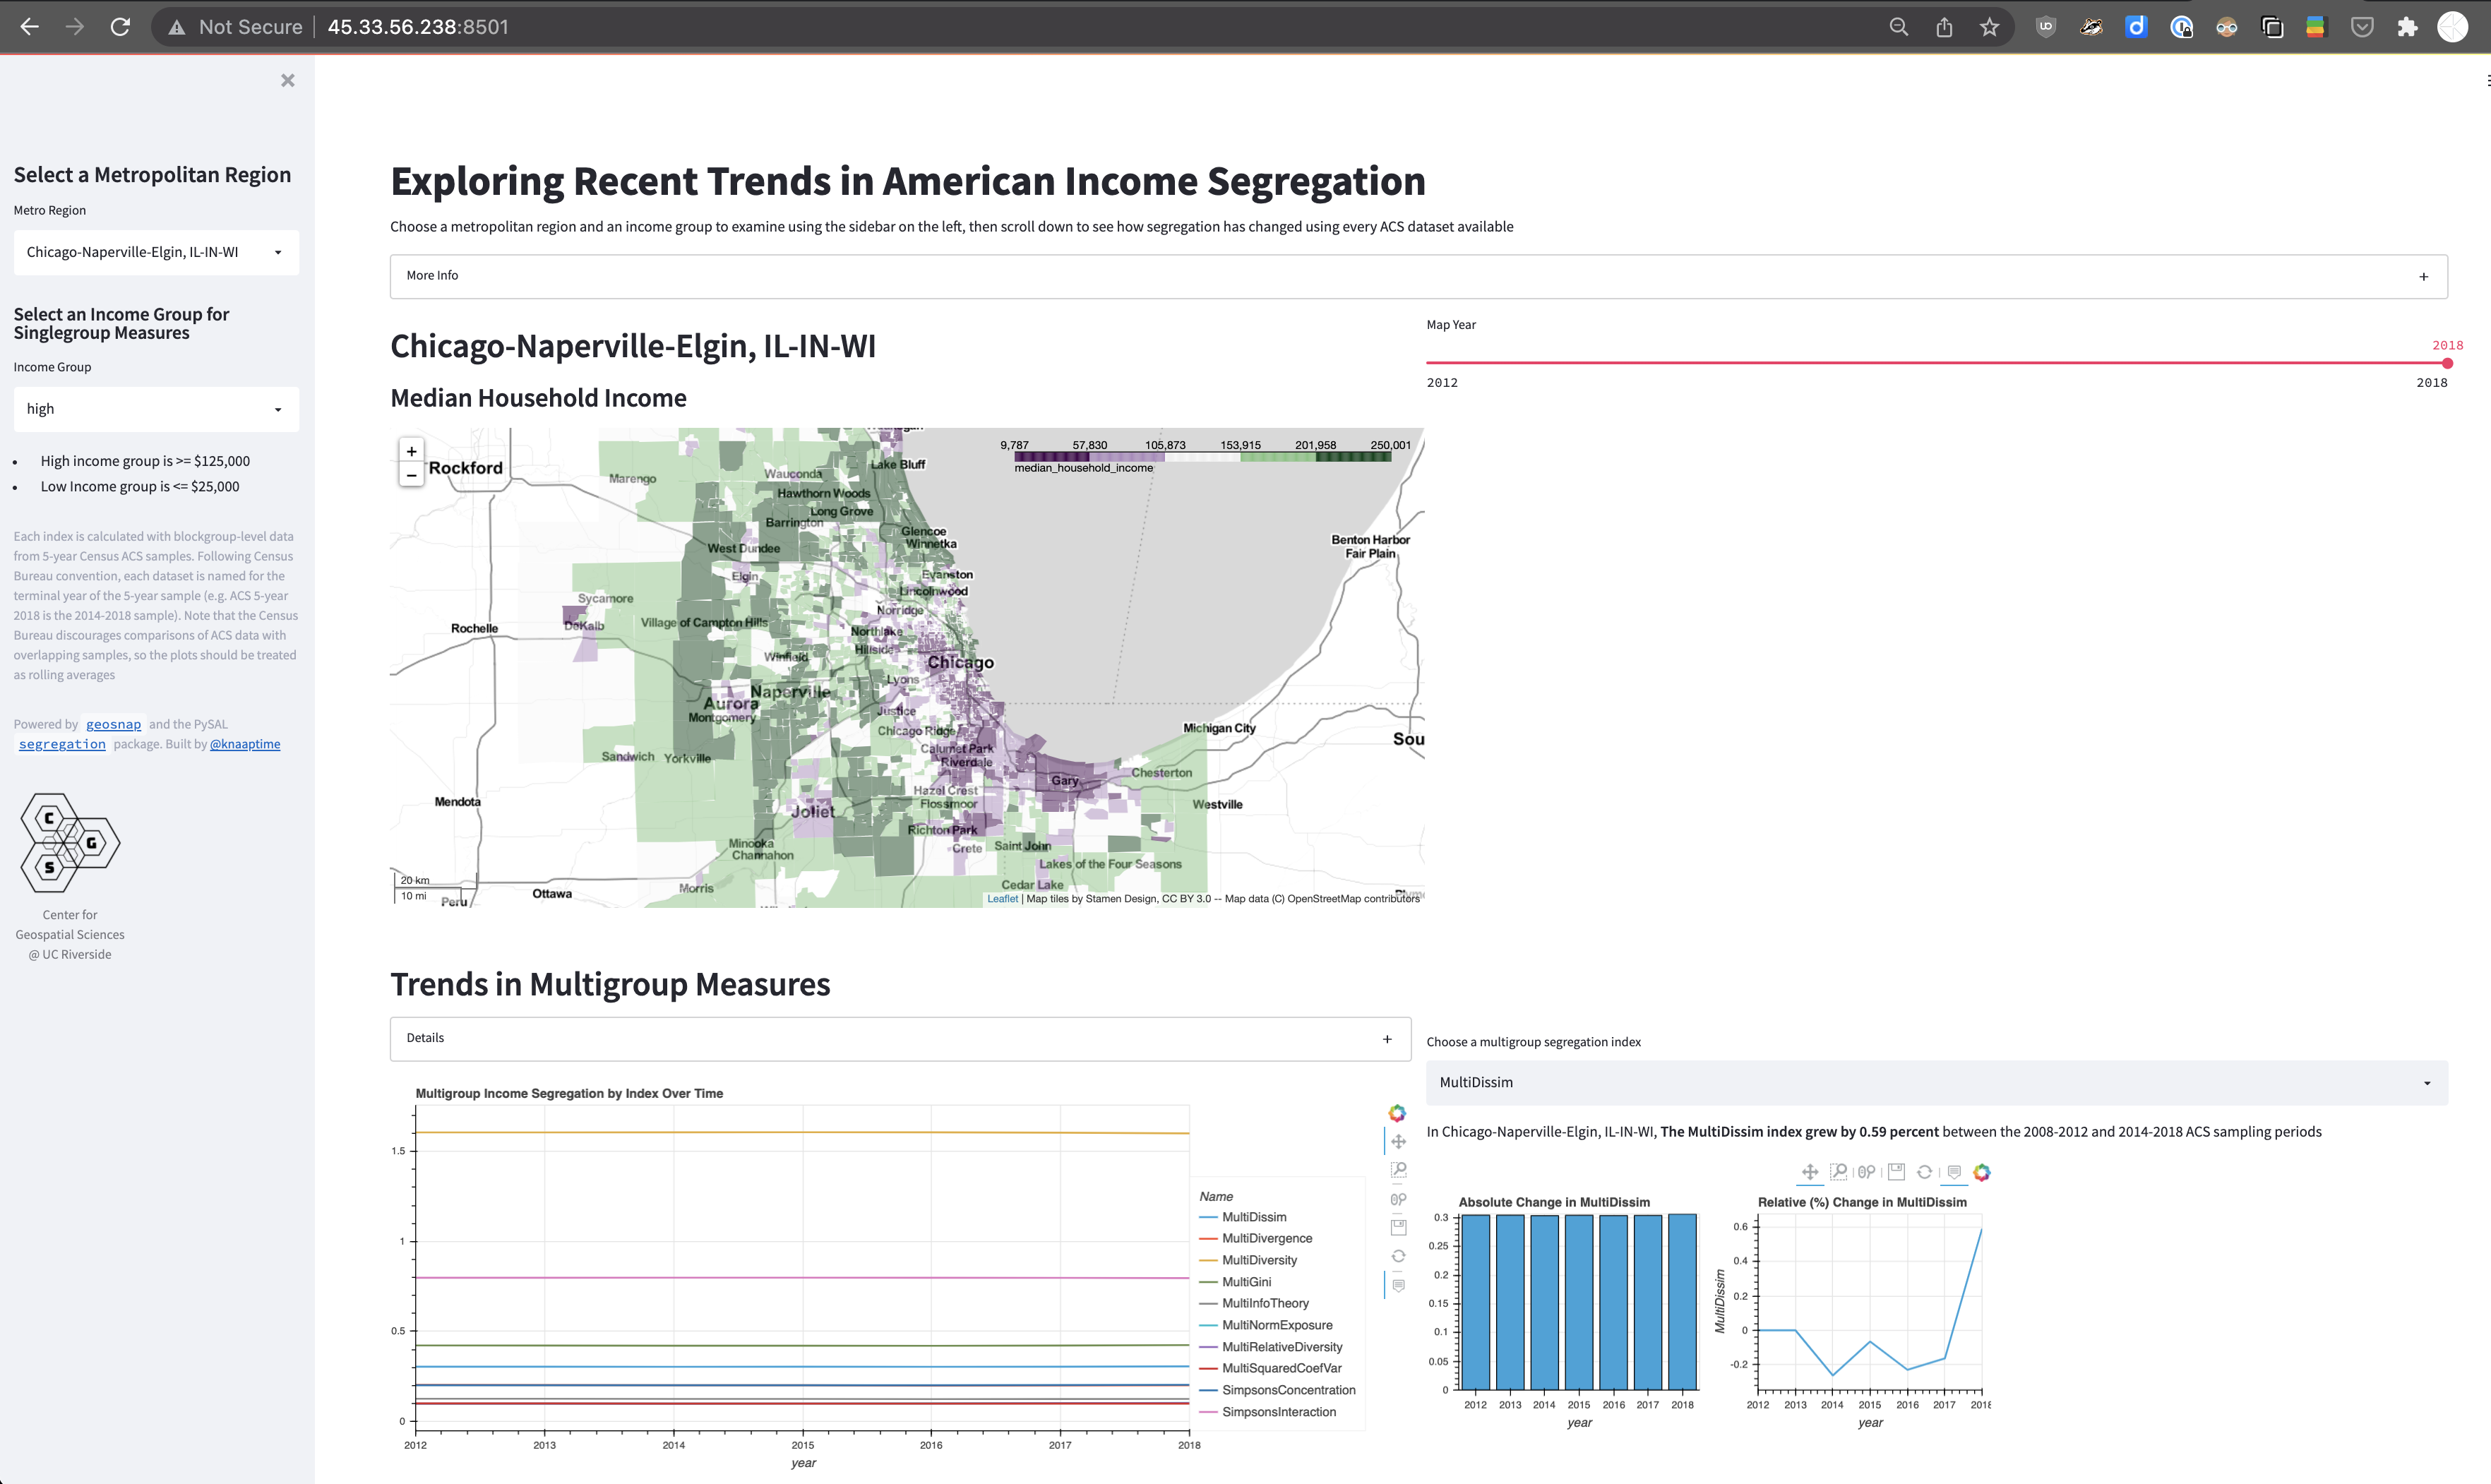
Exploring Trends in Income Segregation with ACS Data
This example dashboard shows how to wrap an interface around engines like geosnap and the PySAL segregation package to build interactive tools to explore data at scale. The demo is accessible here when the server is running. If the demo server is not running, the code is accessible on github and can be setup and run locally in just a few minutes
More
mandown: Reproducible Research and Scholarly Manuscripts in Markdown
Fully open and reproducible science requires a technical writing structure, but LaTeX is too clumsy for my taste, and Python has no solid equivalent of sweave. So I built my own project template with open source tools. mandown is a cookiecutter template providing a project structure for doing reproducible research (Python or R) and drafting a proposal or academic paper or in markdown. Its only requirement is the anaconda package manager.
PySAL: spopt -- Spatial Optimization, Regionalization, & Routing
The PySAL spopt package is an open-source Python library for solving optimization problems with spatial data. Originating from the region module in PySAL, it is under active development for the inclusion of newly proposed models and methods for regionalization, facility location, and transportation-oriented solutions.
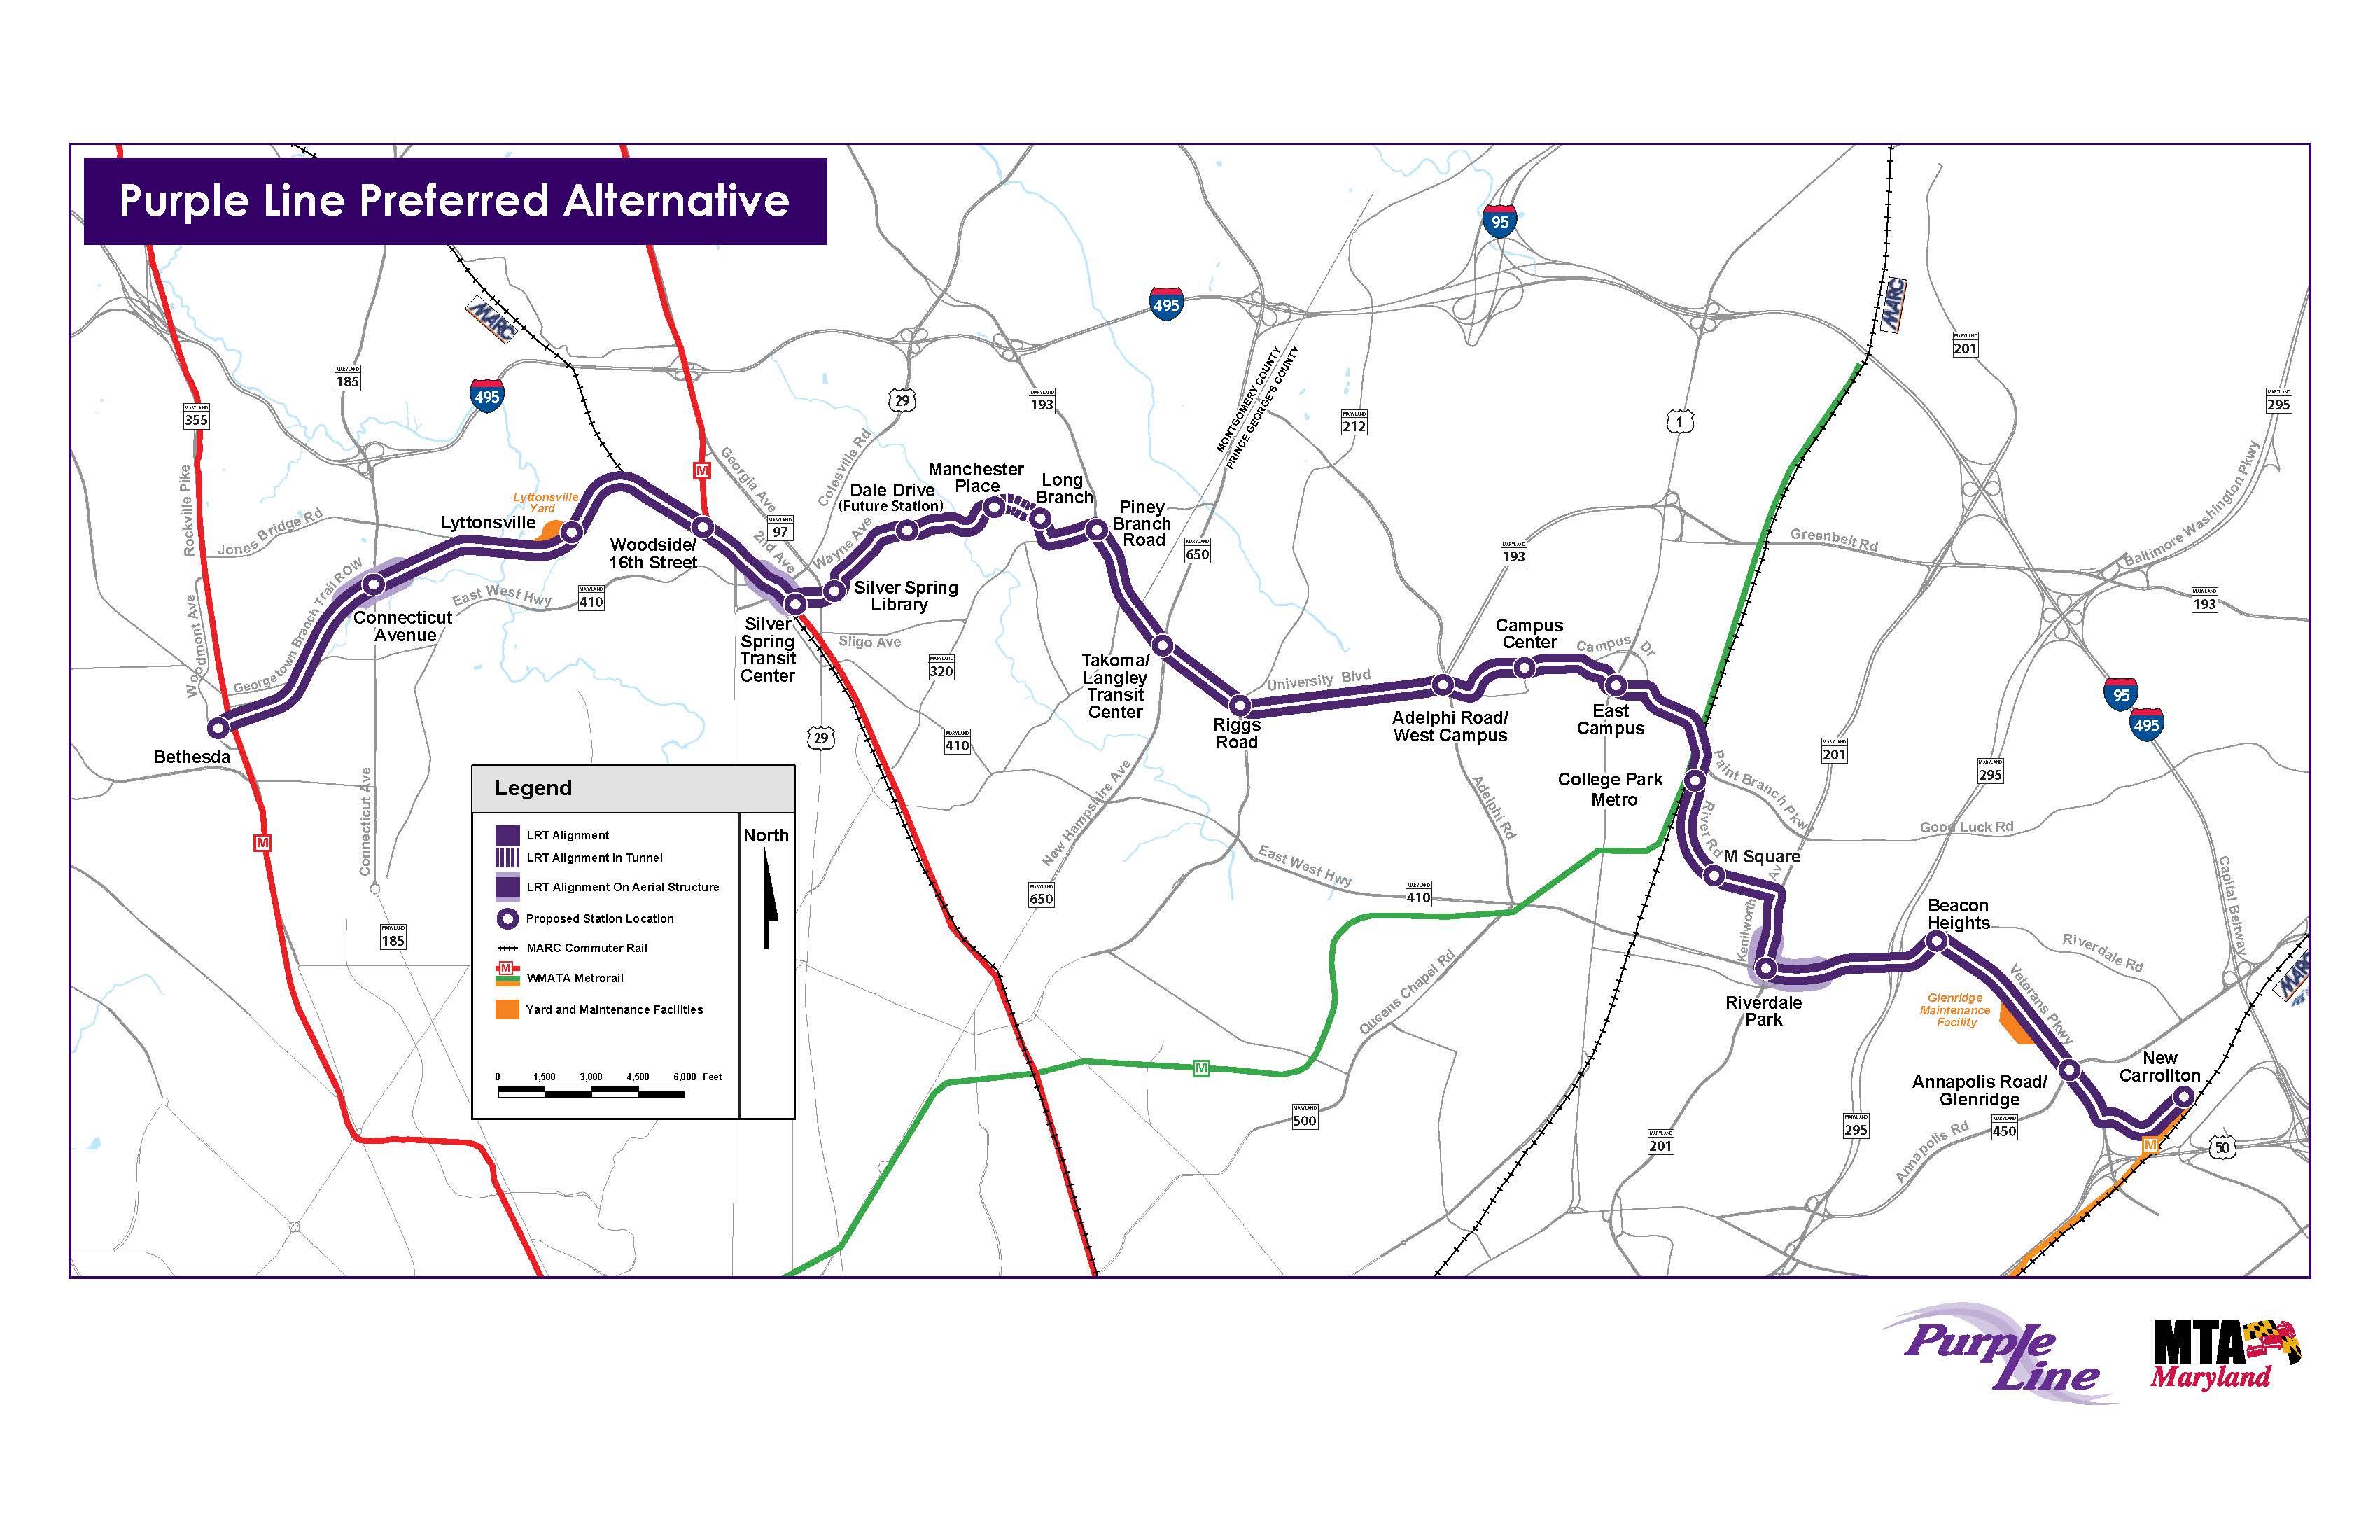
The Purple Line Corridor Coalition Data Dashboard
During my time at the National Center for Smart Growth at UMD, I designed and implemented the first version of the PLCC data dashboard for tracking key employment and demographic indicators throughout the corridor as the line gets built. The dashboard is now maintained by someone else, but retains most of its original design
More