Neighborhood Trends in the Purple Line Corridor
~Celebrating Neighborhood Identities~
Goal: Vibrant and sustainable environments that enhance community health, culture, and sense of place.
Strategies:
Strategies:
- Sustain and enhance walker and bicycle access near stations
- Personal Safety of transit users, walkers, cyclists
- Parks, public spaces and recreational opportunities
- Healthy natural environment
- Preserve and enhance neighborhood culture and identity
- Enhance the physical appearance of communities
- Facilitate transit-oriented development that complements and supports the existing community while minimizing displacement
- Strengthen community input related to the Purple Line and planning and development within the corridor
- Minimize neighborhood disruption during construction
- Minimize neighborhood disruption after construction
Highest Population Change
University of Maryland
 14,069
Highest Non-White Population Change
International Corridor
12,082
Highest Median Household Income
Bethesda
151,449
Graph represents population distribution over the neighborhood (as for year 2014). The International Corridor holds the highest population. Silver Spring has the highest number of White population.
Graph represents percentage population distribution over the neighborhood (as for year 2014). TThe highest population is present in Bethesda followed by University of Maryland and the Silver Spring. International Corridor hold maximum numbers of Hispanic population
| Subarea | Population (2000) | Population Trend | Population (2014) | Periodic Population Change | 2014 - 2000 Change |
|---|---|---|---|---|---|
| Bethesda - Chevy Chase | 14,801 | 20,675 | +5,874 |
||
| Silver Spring | 31,504 | 34,795 | +3,291 |
||
| International Corridor | 49,605 | 59,160 | +9,555 |
||
| University of Maryland | 7,960 | 22,029 | +14,069 |
||
| Riverdale - New Carrollton | 29,452 | 30,659 | +1,207 |
||
| Total Population | 133,322 | 167,318 | +33,996 |
Denotations: D1 - Year 2000, D2 - Year 2006 to 2010, D3 - Year 2009 to 2013, D4 - Year 2010 to 2014. If you hover over the sparkline for Population trend, you can see the value in each division. Population Change column depicts change in population per division.
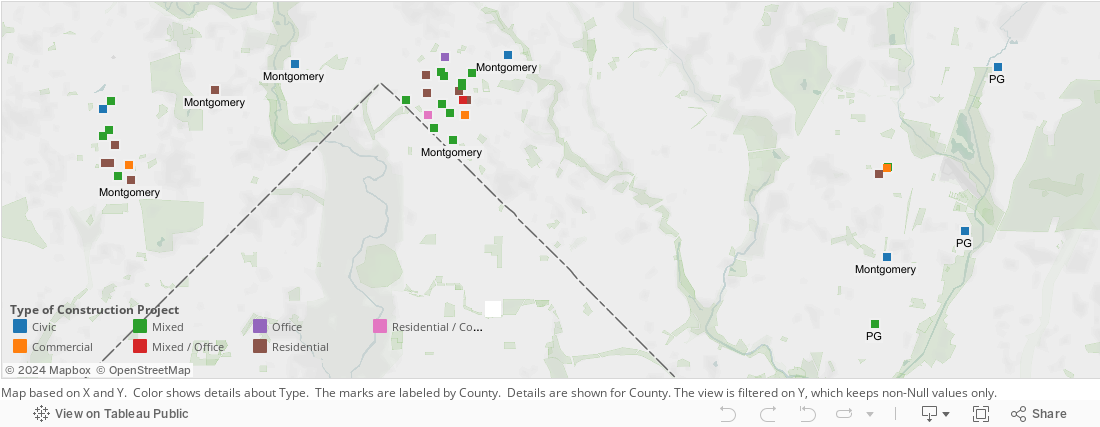
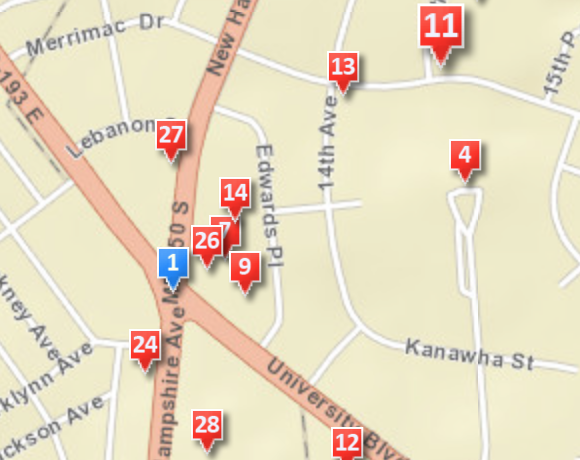
Upcoming and Under Construction Projects in the Neighborhood